Americans
Americans

| Total population | |
|---|---|
| c. 308 million[7] 2010 United States Census c. 328.6 million[8] 2019 estimate | |
| Regions with significant populations | |
| 738,100–1,000,000[9][10] | |
| 316,350–1,000,000[11][12] | |
| 2,694–700,000[13] | |
| 220,000–600,000[14][15] | |
| 324,000[16] | |
| 200,000[17][18] | |
| 139,000–197,143[19][20] | |
| 120,000–158,000[21] | |
| 130,000[22] | |
| 100,000[23] | |
| 71,493[24] | |
| 28,000–70,000[25][26] | |
| 60,000[27] | |
| 60,000[28] | |
| 56,276[29] | |
| 52,486[30] | |
| 51,321[31] | |
| 50,000[32] | |
| 50,000[33] | |
| 45,000[34] | |
| 40,000[35] | |
| 37,000[36] | |
| 33,509[37] | |
| 30,000[38] | |
| 30,000[39] | |
| 25,000[40] | |
| 25,000[41] | |
| 22,082[42] | |
| 19,161[43] | |
| 19,000[44] | |
| 17,751[45] | |
| 15,000[46] | |
| 11,500[47] | |
| 10,645[48] | |
| 10,175[49] | |
| 8,763[50] | |
| 8,000[51] | |
| 8,000[52] | |
| Languages | |
| Primarily American English, but also Spanish and others | |
| Religion | |
| Primarily Christian (Protestantism, Catholicism, and Mormonism)[53] Various non-Christian religions (Judaism and others)[53] | |
Americans are nationals and citizens of the United States of America.[54][55] Although nationals and citizens make up the majority of Americans, some dual citizens, expatriates, and permanent residents may also claim American nationality.[56][57] The United States is home to people of many different ethnic origins. As a result, American culture and law does not equate nationality with race or ethnicity, but with citizenship and permanent allegiance.[58][59][60]
English-speakers, and even speakers of many other languages, typically use the term American to exclusively mean people of the United States; this developed from its original use to differentiate English people of the American colonies from English people of England.[61] The term can also refer to people from the Americas in general[62] (see names for United States citizens).
| Total population | |
|---|---|
| c. 308 million[7] 2010 United States Census c. 328.6 million[8] 2019 estimate | |
| Regions with significant populations | |
| 738,100–1,000,000[9][10] | |
| 316,350–1,000,000[11][12] | |
| 2,694–700,000[13] | |
| 220,000–600,000[14][15] | |
| 324,000[16] | |
| 200,000[17][18] | |
| 139,000–197,143[19][20] | |
| 120,000–158,000[21] | |
| 130,000[22] | |
| 100,000[23] | |
| 71,493[24] | |
| 28,000–70,000[25][26] | |
| 60,000[27] | |
| 60,000[28] | |
| 56,276[29] | |
| 52,486[30] | |
| 51,321[31] | |
| 50,000[32] | |
| 50,000[33] | |
| 45,000[34] | |
| 40,000[35] | |
| 37,000[36] | |
| 33,509[37] | |
| 30,000[38] | |
| 30,000[39] | |
| 25,000[40] | |
| 25,000[41] | |
| 22,082[42] | |
| 19,161[43] | |
| 19,000[44] | |
| 17,751[45] | |
| 15,000[46] | |
| 11,500[47] | |
| 10,645[48] | |
| 10,175[49] | |
| 8,763[50] | |
| 8,000[51] | |
| 8,000[52] | |
| Languages | |
| Primarily American English, but also Spanish and others | |
| Religion | |
| Primarily Christian (Protestantism, Catholicism, and Mormonism)[53] Various non-Christian religions (Judaism and others)[53] | |
Overview
The majority of Americans or their ancestors immigrated to America or are descended from people who were brought as slaves within the past five centuries, with the exception of the Native American population and people from Hawaii, Puerto Rico, Guam, and the Philippine Islands,[63] who became American through expansion of the country in the 19th century,[64] additionally America expanded into American Samoa, the U.S. Virgin Islands and Northern Mariana Islands in the 20th century.[65][55]
Despite its multi-ethnic composition,[66][67] the culture of the United States held in common by most Americans can also be referred to as mainstream American culture, a Western culture largely derived from the traditions of Northern and Western European colonists, settlers, and immigrants.[66] It also includes influences of African-American culture.[68] Westward expansion integrated the Creoles and Cajuns of Louisiana and the Hispanos of the Southwest and brought close contact with the culture of Mexico. Large-scale immigration in the late 19th and early 20th centuries from Southern and Eastern Europe introduced a variety of elements. Immigration from Asia, Africa, and Latin America has also had impact. A cultural melting pot, or pluralistic salad bowl, describes the way in which generations of Americans have celebrated and exchanged distinctive cultural characteristics.[66]
Racial and ethnic groups
The United States of America is a diverse country, racially, and ethnically.[75] Six races are officially recognized by the U.S. Census Bureau for statistical purposes: White, American Indian and Alaska Native, Asian, Black or African American, Native Hawaiian and Other Pacific Islander, and people of two or more races. "Some other race" is also an option in the census and other surveys.[76][77][78]
The United States Census Bureau also classifies Americans as "Hispanic or Latino" and "Not Hispanic or Latino", which identifies Hispanic and Latino Americans as a racially diverse ethnicity that comprises the largest minority group in the nation.[76][77][79]
White and European Americans
People of European descent, or White Americans (also referred to as Caucasian Americans), constitute the majority of the 308 million people living in the United States, with 72.4% of the population in the 2010 United States Census.[1][72][81] They are considered people who trace their ancestry to the original peoples of Europe, the Middle East, and North Africa.[72] Of those reporting to be White American, 7,487,133 reported to be Multiracial; with largest combination being white and black.[81] Additionally, there are 29,184,290 White Hispanics or Latinos.[81] Non-Hispanic Whites are the majority in 46 states. There are four minority-majority states: California, Texas, New Mexico, and Hawaii.[72] In addition, the District of Columbia has a non-white majority.[72] The state with the highest percentage of non-Hispanic White Americans is Maine.[82]
The largest continental ancestral group of Americans are that of Europeans who have origins in any of the original peoples of Europe. This includes people via African, North American, Caribbean, Central American or South American and Oceanian nations that have a large European descended population.[83]
The Spanish were some of the first Europeans to establish a continuous presence in what is now the United States in 1565.[84] Martín de Argüelles born 1566, San Agustín, La Florida then a part of New Spain, was the first person of European descent born in what is now the United States.[85] Twenty-one years later, Virginia Dare born 1587 Roanoke Island in present-day North Carolina, was the first child born in the original Thirteen Colonies to English parents.
In the 2017 American Community Survey, German Americans (13.2%), Irish Americans (9.7%), English Americans (7.1%) and Italian Americans (5.1%) were the four largest self-reported European ancestry groups in the United States forming 35.1% of the total population.[86] However, the English Americans and British Americans demography is considered a serious under-count as they tend to self-report and identify as simply "Americans" (since the introduction of a new "American" category in the 1990 census) due to the length of time they have inhabited America. This is highly over-represented in the Upland South, a region that was settled historically by the British.[87][88][89][90][91][92]
Overall, as the largest group, European Americans have the lowest poverty rate[93] and the second highest educational attainment levels, median household income,[94] and median personal income[95] of any racial demographic in the nation.
| White and European Americans by ancestry group | |||||
|---|---|---|---|---|---|
| Rank | Ancestry group | % of total population | Pop. estimates | Ref(s) | |
| 1 | German | 13.2% | 43,093,766 | [86] | |
| 2 | Irish | 9.7% | 31,479,232 | [86] | |
| 3 | English | 7.1% | 23,074,947 | [86] | |
| 4 | American | 6.1% | 20,024,830 | [86] | |
| 5 | Italian | 5.1% | 16,650,674 | [86] | |
| 6 | Mexican | 5.4% | 16,794,111 | [96] | |
| 7 | Polish | 2.8% | 9,012,085 | [86] | |
| 8 | French (except Basque) French Canadian | 2.4% 0.6% | 7,673,619 2,110,014 | [86] | |
| 9 | Scottish | 1.7% | 5,399,371 | [86] | |
| 10 | Norwegian | 1.3% | 4,295,981 | [86] | |
| 11 | Dutch | 1.2% | 3,906,193 | [86] | |
| Total | White and European American | 59.34% | 231,040,398 | [81] | |
| Source:[97][98] 2010 census & 2017 ACS | |||||
Middle Easterners and North Africans
According to the American Jewish Archives and the Arab American National Museum, some of the first Middle Easterners and North Africans (viz. Jews and Berbers) arrived in the Americas between the late 15th and mid-16th centuries.[99][100][101][102] Many were fleeing ethnic or ethnoreligious persecution during the Spanish Inquisition,[103][104] and a few were also taken to the Americas as slaves.[100]
In 2014, The United States Census Bureau began finalizing the ethnic classification of MENA populations.[105] According to the Arab American Institute (AAI), Arab Americans have family origins in each of the 22 member states of the Arab League.[106] Following consultations with MENA organizations, the Census Bureau announced in 2014 that it would establish a new MENA ethnic category for populations from the Middle East, North Africa and the Arab world, separate from the "white" classification that these populations had previously sought in 1909. The expert groups, felt that the earlier "white" designation no longer accurately represents MENA identity, so they successfully lobbied for a distinct categorization.[107] This new category would also include Jewish Americans.[108] The Census Bureau does not currently ask about whether one is Sikh, because it views them as followers of a religion rather than members of an ethnic group, and it does combine questions concerning religion with race or ethnicity.[109] As of December 2015, the sampling strata for the new MENA category includes the Census Bureau's working classification of 19 MENA groups, as well as Turkish, Sudanese, Djiboutian, Somali, Mauritanian, Armenian, Cypriot, Afghan, Azerbaijani and Georgian groups.[110] In January 2018, it was announced that the Census Bureau would not include the grouping in the 2020 Census.[111]
| Ancestry | 2000 | 2000 (% of US population) | 2010 | 2010 (% of US population) |
|---|---|---|---|---|
| Arab | 1,160,729 | 0.4125% | 1,697,570 | 0.5498% |
| Armenian | 385,488 | 0.1370% | 474,559 | 0.1537% |
| Iranian | 338,266 | 0.1202% | 463,552 | 0.1501% |
| Jewish | 6,155,000 | 2.1810% | 6,543,820 | 2.1157% |
| Total | 8,568,772 | 3.036418% | 9,981,332 | 3.227071% |
Hispanic and Latino Americans
Hispanic or Latino Americans (of any race) constitute the largest ethnic minority in the United States. They form the second largest group after non-Hispanic Whites in the United States, comprising 16.3% of the population according to the 2010 United States Census.[2][115][116]
People of Spanish or Hispanic descent have lived in what is now the United States since the founding of St. Augustine, Florida in 1565 by Pedro Menéndez de Avilés. In the State of Texas, Spaniards first settled the region in the late 1600s and formed a unique cultural group known as Tejanos (Texanos).
| Hispanic and Latino American population by national origin[121][122] | |||||
|---|---|---|---|---|---|
| Rank | National origin | % of total population | Pop. | ||
| 1 | Mexican | 10.29% | 31,798,258 | ||
| 2 | Puerto Rican | 1.49% | 4,623,716 | ||
| 3 | Cuban | 0.57% | 1,785,547 | ||
| 4 | Salvadoran | 0.53% | 1,648,968 | ||
| 5 | Dominican | 0.45% | 1,414,703 | ||
| 6 | Guatemalan | 0.33% | 1,044,209 | ||
| 7 | Colombian | 0.3% | 908,734 | ||
| 8 | Spanish | 0.2% | 635,253 | ||
| 9 | Honduran | 0.2% | 633,401 | ||
| 10 | Ecuadorian | 0.1% | 564,631 | ||
| All other | 2.64% | 8,162,193 | |||
| Hispanic and Latino American (total) | 16.34% | 50,477,594 | |||
| 2010 United States Census | |||||
Black and African Americans
Black and African Americans are citizens and residents of the United States with origins in Sub-Saharan Africa.[123] According to the Office of Management and Budget, the grouping includes individuals who self-identify as African American, as well as persons who emigrated from nations in the Caribbean and Sub-Saharan Africa.[124] The grouping is thus based on geography, and may contradict or misrepresent an individual's self-identification since not all immigrants from Sub-Saharan Africa are "Black". Among these racial outliers are persons from Cape Verde, Madagascar, various Arab states and Hamito-Semitic populations in East Africa and the Sahel, and the Afrikaners of Southern Africa.[123]
African Americans (also referred to as Black Americans or Afro-Americans, and formerly as American Negroes) are citizens or residents of the United States who have origins in any of the black populations of Africa.[125] According to the 2009 American Community Survey, there were 38,093,725 Black and African Americans in the United States, representing 12.4% of the population. In addition, there were 37,144,530 non-Hispanic blacks, which comprised 12.1% of the population.[126] This number increased to 42 million according to the 2010 United States Census, when including Multiracial African Americans,[124] making up 14% of the total U.S. population.[3][127] Black and African Americans make up the second largest group in the United States, but the third largest group after White Americans and Hispanic or Latino Americans (of any race).[115] The majority of the population (55%) lives in the South; compared to the 2000 Census, there has also been a decrease of African Americans in the Northeast and Midwest.[127]
Most African Americans are the direct descendants of captives from West Africa, who survived the slavery era within the boundaries of the present United States.[128] As an adjective, the term is usually spelled African-American.[129] The first West African slaves were brought to Jamestown, Virginia in 1619. The English settlers treated these captives as indentured servants and released them after a number of years. This practice was gradually replaced by the system of race-based slavery used in the Caribbean.[130] All the American colonies had slavery, but it was usually the form of personal servants in the North (where 2% of the people were slaves), and field hands in plantations in the South (where 25% were slaves);[131] by the beginning of the American Revolutionary War 1/5th of the total population was enslaved.[132] During the revolution, some would serve in the Continental Army or Continental Navy,[133][134] while others would serve the British Empire in Lord Dunmore's Ethiopian Regiment, and other units.[135] By 1804, the northern states (north of the Mason–Dixon line) had abolished slavery.[136] However, slavery would persist in the southern states until the end of the American Civil War and the passage of the Thirteenth Amendment.[137] Following the end of the Reconstruction Era, which saw the first African American representation in Congress,[138] African Americans became disenfranchised and subject to Jim Crow laws,[139] legislation that would persist until the passage of the Civil Rights Act of 1964 and Voting Rights Act due to the Civil Rights Movement.[140]
According to US Census Bureau data, very few African immigrants self-identify as African American. On average, less than 5% of African residents self-reported as "African American" or "Afro-American" on the 2000 US Census. The overwhelming majority of African immigrants (~95%) identified instead with their own respective ethnicities. Self-designation as "African American" or "Afro-American" was highest among individuals from West Africa (4%-9%), and lowest among individuals from Cape Verde, East Africa and Southern Africa (0%-4%).[141] African immigrants may also experience conflict with African Americans.[142]
| Black and African American population by ancestry group[97][124] | ||||
|---|---|---|---|---|
| Rank | Ancestry group | Percentage of total est. population | Pop. estimates | |
| 1 | Jamaican | 0.31% | 986,897 | |
| 2 | Haitian | 0.28% | 873,003 | |
| 3 | Nigerian | 0.08% | 259,934 | |
| 4 | Trinidadian and Tobagonian | 0.06% | 193,233 | |
| 5 | Ghanaian | 0.03% | 94,405 | |
| 6 | Barbadian | 0.01% | 59,236 | |
| Sub-Saharan African (total) | 0.92% | 2,864,067 | ||
| West Indian (total) (except Hispanic groups) | 0.85% | 2,633,149 | ||
| Black and African American (total) | 13.6% | 42,020,743 | ||
| 2010 United States Census & 2009–2011 American Community Survey | ||||
Asian Americans
Another significant population is the Asian American population, comprising 17.3 million in 2010, or 5.6% of the U.S. population.[4][143][144] California is home to 5.6 million Asian Americans, the greatest number in any state.[145] In Hawaii, Asian Americans make up the highest proportion of the population (57 percent).[145] Asian Americans live across the country, yet are heavily urbanized, with significant populations in the Greater Los Angeles Area, New York metropolitan area, and the San Francisco Bay Area.[146]
They are by no means a monolithic group. The largest sub-groups are immigrants or descendants of immigrants from Cambodia, Mainland China, India, Japan, Korea, Laos, Pakistan, the Philippines, Taiwan, Thailand, and Vietnam. Asians overall have higher income levels than all other racial groups in the United States, including whites, and the trend appears to be increasing in relation to those groups.[147] Additionally, Asians have a higher education attainment level than all other racial groups in the United States.[148][149] For better or for worse, the group has been called a model minority.[150][151][152]
While Asian Americans have been in what is now the United States since before the Revolutionary War,[153][154][155] relatively large waves of Chinese, Filipino, and Japanese immigration did not begin until the mid-to-late 19th century.[155] Immigration and significant population growth continue to this day.[156] Due to a number of factors, Asian Americans have been stereotyped as "perpetual foreigners".[157][158]
| Asian American ancestries[143] | ||||
|---|---|---|---|---|
| Rank | Ancestry | Percentage of total population | Pop. | |
| 1 | Chinese | 1.2% | 3,797,379 | |
| 2 | Filipino | 1.1% | 3,417,285 | |
| 3 | Indian | 1.0% | 3,183,063 | |
| 4 | Vietnamese | 0.5% | 1,737,665 | |
| 5 | Korean | 0.5% | 1,707,027 | |
| 6 | Japanese | 0.4% | 1,304,599 | |
| Other Asian | 0.9% | 2,799,448 | ||
| Asian American (total) | 5.6% | 17,320,856 | ||
| 2010 United States Census | ||||
American Indians and Alaska Natives
According to the 2010 Census, there are 5.2 million people who are Native Americans or Alaska Native alone, or in combination with one or more races; they make up 1.7% of the total population.[5][159] According to the Office of Management and Budget (OMB), an "American Indian or Alaska Native" is a person whose ancestry have origins in any of the original peoples of North, Central, or South America.[159] 2.3 million individuals who are American Indian or Alaskan Native are multiracial;[159] additionally the plurality of American Indians reside in the Western United States (40.7%).[159] Collectively and historically this race has been known by several names;[160] as of 1995, 50% of those who fall within the OMB definition prefer the term "American Indian", 37% prefer "Native American" and the remainder have no preference or prefer a different term altogether.[161]
Native Americans, whose ancestry is indigenous to the Americas, originally migrated to the two continents between 10,000-45,000 years ago.[162] These Paleoamericans spread throughout the two continents and evolved into hundreds of distinct cultures during the pre-Columbian era.[163] Following the first voyage of Christopher Columbus,[164] the European colonization of the Americas began, with St. Augustine, Florida becoming the first permanent European settlement in the continental United States.[165] From the 16th through the 19th centuries, the population of Native Americans declined in the following ways: epidemic diseases brought from Europe;[166] genocide and warfare at the hands of European explorers and colonists,[167][168] as well as between tribes;[169][170] displacement from their lands;[171] internal warfare,[172] enslavement;[173] and intermarriage.[174][175]
| American Indian and Alaska Native population by selected tribal groups[159][176] | ||||
|---|---|---|---|---|
| Rank | National origin | Percentage of total population | Pop. | |
| 1 | Cherokee | 0.26% | 819,105 | |
| 2 | Navajo | 0.1% | 332,129 | |
| 3 | Choctaw | 0.06% | 195,764 | |
| 4 | Mexican American Indian | 0.05% | 175,494 | |
| 5 | Chippewa | 0.05% | 170,742 | |
| 6 | Sioux | 0.05% | 170,110 | |
| All other | 1.08% | 3,357,235 | ||
| American Indian (total) | 1.69% | 5,220,579 | ||
| 2010 United States Census | ||||
Native Hawaiians and other Pacific Islanders
As defined by the United States Census Bureau and the Office of Management and Budget, Native Hawaiians and other Pacific Islanders are "persons having origins in any of the original peoples of Hawaii, Guam, Samoa, or other Pacific Islands".[177] Previously called Asian Pacific American, along with Asian Americans beginning in 1976, this was changed in 1997.[178] As of the 2010 United States Census there are 1.2 million who reside in the United States, and make up 0.4% of the nation's total population, of whom 56% are multiracial.[6][179] 14% of the population have at least a bachelor's degree,[179] and 15.1% live in poverty, below the poverty threshold.[179] As compared to the 2000 United States Census this population grew by 40%;[177] and 71% live in the West; of those over half (52%) live in either Hawaii or California, with no other states having populations greater than 100,000.[177] The largest concentration of Native Hawaiians and other Pacific Islanders, is Honolulu County in Hawaii,[179] and Los Angeles County in the continental United States.[177]
| Native Hawaiian and Other Pacific Islander by ancestries[177] | ||||
|---|---|---|---|---|
| Rank | Ancestry | Percentage | Pop. | |
| 1 | Hawaiian | 0.17% | 527,077 | |
| 2 | Samoan | 0.05% | 184,440 | |
| 3 | Chamorro | 0.04% | 147,798 | |
| 4 | Tongan | 0.01% | 57,183 | |
| Other Pacific Islanders | 0.09% | 308,697 | ||
| Native Hawaiian and Other Pacific Islander (total) | 0.39% | 1,225,195 | ||
| 2010 United States Census | ||||
Two or more races
The United States has a growing multiracial identity movement.[180] Multiracial Americans numbered 7.0 million in 2008, or 2.3% of the population;[144] by the 2010 census the Multiracial increased to 9,009,073, or 2.9% of the total population.[181] They can be any combination of races (White, Black or African American, Asian, American Indian or Alaska Native, Native Hawaiian or other Pacific Islander, "some other race") and ethnicities.[182] The largest population of Multiracial Americans were those of White and African American descent, with a total of 1,834,212 self-identifying individuals.[181] Barack Obama, 44th President of the United States, is biracial with his mother being of English and Irish descent and his father being of Kenyan birth;[183][184] however, Obama only self-identifies as being African American.[185][186]
| Population by selected Two or More Races Population[187] | ||||
|---|---|---|---|---|
| Rank | Specific Combinations | Percentage of total population | Pop. | |
| 1 | White; Black | 0.59% | 1,834,212 | |
| 2 | White; Some Other Race | 0.56% | 1,740,924 | |
| 3 | White; Asian | 0.52% | 1,623,234 | |
| 4 | White; Native American | 0.46% | 1,432,309 | |
| 5 | African American; Some Other Race | 0.1% | 314,571 | |
| 6 | African American; Native American | 0.08% | 269,421 | |
| All other specific combinations | 0.58% | 1,794,402 | ||
| Multiracial American (total) | 2.9% | 9,009,073 | ||
| 2010 United States Census | ||||
Some other race
According to the 2010 United States Census, 6.2% or 19,107,368 Americans chose to self-identify with the "some other race" category, the third most popular option. Also, 36.7% or 18,503,103 Hispanic/Latino Americans chose to identify as some other race as these Hispanic/Latinos may feel the U.S. Census does not describe their European and American Indian ancestry as they understand it to be.[188] A significant portion of the Hispanic and Latino population self-identifies as Mestizo, particularly the Mexican and Central American community. Mestizo is not a racial category in the U.S. Census, but signifies someone who has both European and American Indian ancestry.
National personification
A national personification is an anthropomorphism of a nation or its people; it can appear in both editorial cartoons and propaganda.
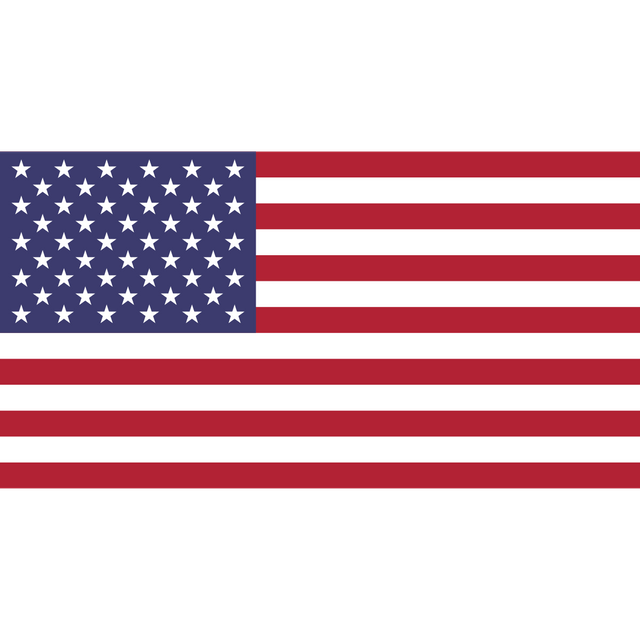
Uncle Sam is a national personification of the United States and sometimes more specifically of the American government, with the first usage of the term dating from the War of 1812. He is depicted as a stern elderly white man with white hair and a goatee beard, and dressed in clothing that recalls the design elements of the flag of the United States – for example, typically a top hat with red and white stripes and white stars on a blue band, and red and white striped trousers.
Columbia is a poetic name for the Americas and the feminine personification of the United States of America, made famous by African-American poet Phillis Wheatley during the American Revolutionary War in 1776. It has inspired the names of many persons, places, objects, institutions, and companies in the Western Hemisphere and beyond, including the District of Columbia, the seat of government of the United States.
Language
| Language | Percent of population | Number of speakers |
|---|---|---|
| English | 80.38% | 233,780,338 |
| *Combined total of all languages other than English* | 19.62% | 57,048,617 |
| Spanish (excluding Puerto Rico and Spanish Creole) | 12.19% | 35,437,985 |
| Chinese (including Cantonese and Mandarin) | 0.9% | 2,567,779 |
| Tagalog | 0.53% | 1,542,118 |
| Vietnamese | 0.44% | 1,292,448 |
| French | 0.44% | 1,288,833 |
| Korean | 0.38% | 1,108,408 |
| German | 0.38% | 1,107,869 |
| Hindustani (includes Hindi and Urdu) | 0.32% | 942,794 |
English is the de facto national language. Although there is no official language at the federal level, some laws—such as U.S. naturalization requirements—standardize English. In 2007, about 226 million, or 80% of the population aged five years and older, spoke only English at home. Spanish, spoken by 12% of the population at home, is the second most common language and the most widely taught second language.[190][191] Some Americans advocate making English the country's official language, as it is in at least twenty-eight states.[192] Both English and Hawaiian are official languages in Hawaii by state law.[193]
While neither has an official language, New Mexico has laws providing for the use of both English and Spanish, as Louisiana does for English and French.[194] Other states, such as California, mandate the publication of Spanish versions of certain government documents. The latter include court forms.[195] Several insular territories grant official recognition to their native languages, along with English: Samoan and Chamorro are recognized by American Samoa and Guam, respectively; Carolinian and Chamorro are recognized by the Northern Mariana Islands; Spanish is an official language of Puerto Rico.
Religion
| Affiliation | % of U.S. population | |
|---|---|---|
| Christian | 70.6 | 70.6 |
| Protestant | 46.5 | 46.5 |
| Evangelical Protestant | 25.4 | 25.4 |
| Mainline Protestant | 14.7 | 14.7 |
| Black church | 6.5 | 6.5 |
| Catholic | 20.8 | 20.8 |
| The Church of Jesus Christ of Latter-day Saints | 1.6 | 1.6 |
| Jehovah's Witnesses | 0.8 | 0.8 |
| Eastern Orthodox | 0.5 | 0.5 |
| Other Christian | 0.4 | 0.4 |
| Non-Christian faiths | 5.9 | 5.9 |
| Jewish | 1.9 | 1.9 |
| Muslim | 0.9 | 0.9 |
| Buddhist | 0.7 | 0.7 |
| Hindu | 0.7 | 0.7 |
| Other Non-Christian faiths | 1.8 | 1.8 |
| Unaffiliated | 22.8 | 22.8 |
| Nothing in particular | 15.8 | 15.8 |
| Agnostic | 4.0 | 4 |
| Atheist | 3.1 | 3.1 |
| Don't know/refused answer | 0.6 | 0.6 |
| Total | 100 | 100 |
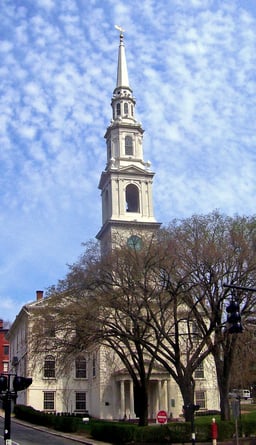
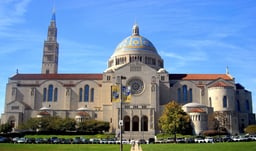
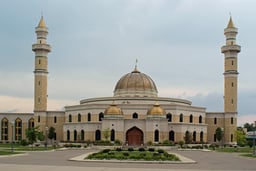
Religion in the United States has a high adherence level compared to other developed countries, as well as a diversity in beliefs. The First Amendment to the country's Constitution prevents the Federal government from making any "law respecting an establishment of religion, or prohibiting the free exercise thereof". The U.S. Supreme Court has interpreted this as preventing the government from having any authority in religion. A majority of Americans report that religion plays a "very important" role in their lives, a proportion unusual among developed countries, although similar to the other nations of the Americas.[197] Many faiths have flourished in the United States, including both later imports spanning the country's multicultural immigrant heritage, as well as those founded within the country; these have led the United States to become the most religiously diverse country in the world.[198]
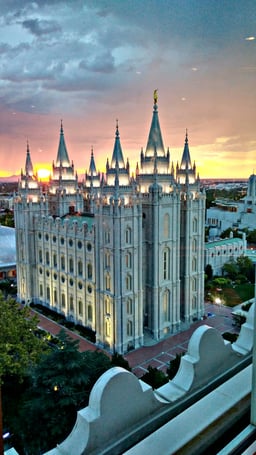
The majority of Americans (76%) are Christians, mostly within Protestant and Catholic denominations; these adherents constitute 51% and 25% of the population, respectively.[199] Other religions include Buddhism, Hinduism, Islam, and Judaism, which collectively make up about 4% to 5% of the adult population.[199][200][201] Another 15% of the adult population identifies as having no religious belief or no religious affiliation.[199] According to the American Religious Identification Survey, religious belief varies considerably across the country: 59% of Americans living in Western states (the "Unchurched Belt") report a belief in God, yet in the South (the "Bible Belt") the figure is as high as 86%.[199][202]
Several of the original Thirteen Colonies were established by settlers who wished to practice their own religion without discrimination: the Massachusetts Bay Colony was established by English Puritans, Pennsylvania by Irish and English Quakers, Maryland by English and Irish Catholics, and Virginia by English Anglicans. Although some individual states retained established religious confessions well into the 19th century, the United States was the first nation to have no official state-endorsed religion.[203] Modeling the provisions concerning religion within the Virginia Statute for Religious Freedom, the framers of the Constitution rejected any religious test for office, and the First Amendment specifically denied the federal government any power to enact any law respecting either an establishment of religion or prohibiting its free exercise, thus protecting any religious organization, institution, or denomination from government interference. The decision was mainly influenced by European Rationalist and Protestant ideals, but was also a consequence of the pragmatic concerns of minority religious groups and small states that did not want to be under the power or influence of a national religion that did not represent them.[204]
Culture
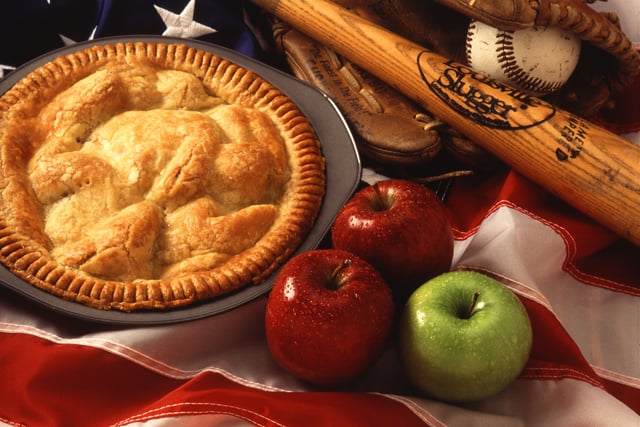
Apple pie and baseball are icons of American culture.
The American culture is primarily a Western culture, but is influenced by Native American, West African, Asian, Polynesian, and Latino cultures.
Its chief early European influences came from English, Scottish, Welsh, and Irish settlers of colonial America during British rule. British culture, due to colonial ties with Britain that spread the English language, legal system and other cultural inheritances, had a formative influence.[205] Other important influences came from other parts of Europe, especially Germany,[206] France,[207] and Italy.[208]
Original elements also play a strong role, such as Jeffersonian democracy.[209] Thomas Jefferson's Notes on the State of Virginia was perhaps the first influential domestic cultural critique by an American and a reactionary piece to the prevailing European consensus that America's domestic originality was degenerate.[209] Prevalent ideas and ideals that evolved domestically, such as national holidays, uniquely American sports, military tradition,[210] and innovations in the arts and entertainment give a strong sense of national pride among the population as a whole.[211]
American culture includes both conservative and liberal elements, scientific and religious competitiveness, political structures, risk taking and free expression, materialist and moral elements. Despite certain consistent ideological principles (e.g. individualism, egalitarianism, faith in freedom and democracy), the American culture has a variety of expressions due to its geographical scale and demographic diversity.
Diaspora
Americans have migrated to many places around the world, including Argentina, Australia, Britain, Brazil, Canada, Chile, France, Germany, Japan, Mexico, New Zealand and the Philippines. As of 2016, there were approximately 9 million U.S citizens living outside of the United States.[212]
See also
American ancestry
Americans and Canadians in Chile
American studies
Ancestry of the people of the United States
Deportation of Americans from the United States
Emigration from the United States
Hyphenated American
Immigration to the United States
Making North America (2015 PBS film)
Names for United States citizens
Race and ethnicity in the United States
