PPG Signal Analysis
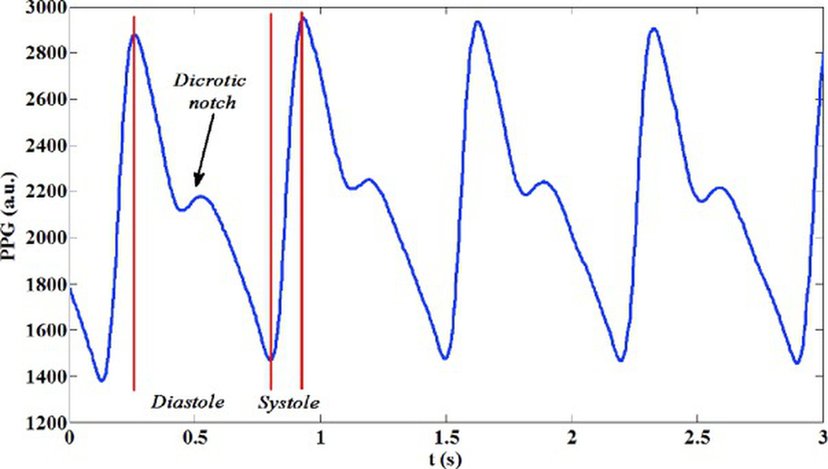
PPG Signal Analysis
PhotoPlethysmographyis an examination for detection of volumetric changes in the blood especially in the peripheral regions of the body (e.g. fingertips, toes, etc.). This examination is done by absorption of low-intensity light waves (red or infra-red) at the surface of the skin using a device called pulse oximetry. This device contains two parts: [14]
Optical Transducers:A transducer is a mechanism to convert non-electronic data into electronic data. A thermistor is one of the most common examples of a transducer. A thermistor works by converting a temperature difference to a voltage differential that can be taken to calibrate tote with other temperatures. Since PPG waveforms are captured by absorption of light, hence optical transducer uses energy from photons (light particles) to create a change in voltage. There are mainly two parts of an optical transducer: It consists of light emitting diodes (LED) which emit light either in red or infra-red depending upon the applications and a photo detector to detect whether the light either got transmitted or reflected.[1]
[1]Pre-Processing Circuits: It mainly consists of converters to generate PPG waveforms from the captured light using photo-detectors-an-amplifier by converting current to voltage. [-1]
Applications of PPG signal:
These signals are mainly used in assessing various cardiovascular systems.
Some of the clinical physiological parameters where PPG signals find its applications are:
-Monitoring of heart rate (HR) [16]
-Blood oxygen saturation (SpO2) [17]
-Blood Pressure measurement (BP) [18]
-Cardiac Output vascular assessment (CO) [20]
-The assessment of the blood vessel viscosity.
[12]
Terminologies:
Photoplethysmogram (PPG):It is the signal generated from local variations of blood volume in tissues.
It represents the peripheral pulse wave modulated by heart activity, respiration and other physiological effects.
Software Processing Unit : Depending upon the applications, the software unit is based on a PPG processing software in which different processing methods can be developed.
Systole:The time period when the heart is contracting.
The period specifically during which the left ventricle of the heart contracts.
It is the maximum arterial pressure during contraction of the left ventricle of the heart.
Diastole:It is the period of relaxation of the heart muscle, accompanied by the filling of the chambers with blood.
Systolic Amplitude:This is an indicator of the pulsatile changes in blood volume by arterial blood flow around the measurement site which can be fingertip or any part of the body.
This is inversely proportional to the systolic pressure.
Pulse Width:It is defined as the pulse width at the half height of the systolic peak w.r.t to the PPG signals.
In normal sense, it is defined as the elapsed time between the rising and falling edges of a signal pulse.
Pulse Area:It is the area under the PPG curve.
It can be visualised as the division at the dicrotic notch and defined as the ratio of these two areas.
Peak to Peak Interval (PP):It is defined as the distance between two consecutive systolic peaks.
The RR interval in the ECG signal correlates closely with the PP interval as both represent a complete heart cycle.
Pulse Interval (PI):It is defined as the beginning(of the rising edge) and the end (falling edge) of the PPG waveform.
OR we can say that the time interval between consecutive pulses both measured at the same point in the pulse.
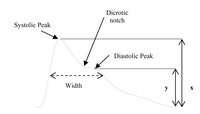
Augmentation Index (AI):It is the measure of the contribution that the wave reflection makes to the systolic arterial pressure.
Or it is a measure of systemic arterial stiffness derived from the ascending aortic pressure waveform.
It can be described as the ratio of the diastolic peak to the systolic peak.
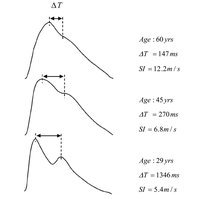
Large Artery Stiffness Index (SI):It is defined as the ratio of the height of the subject to the time delay between the systolic and diastolic peaks.
Since systole means the time taken during contraction of the heart in order to pump blood to the body - peripheral parts of the body.
So, with age stiffness of the arteries increases due to which systolic wave time increases and hence the time delay between the peaks also increases.
All this leads to increase in the stiffness index with age since the change in time comes in the denominator.
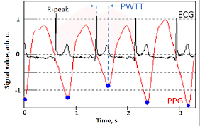
Pulse Transit Time (PTT):It is the time taken by the pulse pressure to reach to the periphery from the heart.
It is normally defined as the time between the R-peak of the ECG and the onset of the PPG systolic wave.
Pulse Wave Velocity (PWV):It is the velocity with which the pulse propagates over the path from heart to periphery.
Pre-processing of the PPG Signal:
To get to and to extract the parameters and indices described above for the PPG signal, it is required to process the PPG signal first.
This is needed because the PPG signals are influenced by different levels and types of noise.
The quality of the PPG signal depends upon the site of measurements and the properties of the subject’s skin at measurement, including the individual skin structure, the blood oxygen saturation, blood flow rate, skin temperatures, and the measuring environment.
These factors generate several types of the additive artefact which may be contained within the PPG signals.
This may affect the extraction of features and hence the overall diagnosis.
Processing for the detection of PPG Parameters and Indices:
Once the PPG signal filtered the different parameters described above several other parameters can be derived.
However, as one can notice most of these parameters are concerned with measurements related to the detection of peaks, valleys and infection points.
Detection of peaks is almost straightforward detected by comparing successive samples of the PPG signal if one considers that the PPG is highly filtered.
In such situation, three successive samples are used and compared to each other.
The decision is made on the peak if the second is higher than the first and the third or the first and second are equal or higher than the third.
Such approach allows good detection of the Peaks throughout successive heart cycles and consequently allows the generation of heartbeats after appropriate thresholding.
However, since peaks and valleys can also be considered as inflexion points in the PPG waveform, differentiation of this waveform will allow localisation of these points.
So, the first derivative of the PPG signal generates a waveform in which zero crossing points have been used as marking points for determining time durations named as CT (crest time) and change in time (the time between the systolic and diastolic peaks).
The CT corresponds to the time from the foot of the PPG waveform to its peak.
Whereas change in time corresponds to the time between the first and the second positive to the negative crossing.
So, it is concluded that change in time, CT, and the stiffness index were the best features for accurate classification of cardiovascular disease using the first derivative of the PPG.
However, the second derivative shows that more marked points can be used to analyse the PPG waveform.
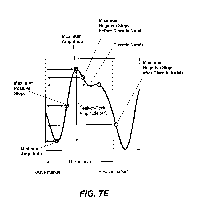
The second derivative of the PPG signal generates a waveform with five successive waves (a, b, c, d, e).
The waves a,b,c, and d correspond to systolic waves whereas the waves represent the dicrotic not which corresponds to the early diastolic positive waves.
These waves generated by the second derivative PPG signal have been measured and used differently in assessing the cardiovascular system as reported in the scientific research domain.
